"If you can’t measure it, you can’t improve it." - Peter Drucker
Imagine this. You load a site on your phone. You wait as one second passes... two seconds... three seconds...
At this point — the three-second mark — one out of two users has lost interest in your site and left. This data point illustrates why page speed is so important: It’s far and away one of the most important metrics when building a website. Consider the following:
- Decreasing your page’s load time from five seconds to two seconds can decrease your bounce rate from 38% to 9%! That’s a whopping 71% decrease in bounce rate for a three-second reduction in load time
- A Google study showed that sites that take longer than three seconds to load have a 53% bounce rate.
- Google has used site speed as a direct ranking factor for desktop since 2010. More recently, Google has started putting larger emphasis on page speed for mobile rankings since 2018.
What does this have to do with Rails? Rails is prevalent in web development. In fact, nearly one in five of the largest 10,000 sites (measured by traffic) are built in Rails. Rails is known as a framework that is quick to learn, easy to build on due to its convention over configuration paradigm, and a pleasure to use. But as is the case with any language, there are steps we can take to improve web performance when working in a Rails codebase.
In this article, we’re going to explore how to integrate Google’s PageSpeed Insights API into our Rails app. Our integration will be based on the premise that we're hosting the app on Heroku, assuming you know your way around using the Rails CLI and ActiveRecord.
RELATED: Best Practices for Testing in Go
Google PageSpeed Insights API
Google PageSpeed Insights (PSI) reports on a site’s performance, accessibility, and SEO and provides action items to make improvements. In this article, we’ll be focused on its performance reporting.
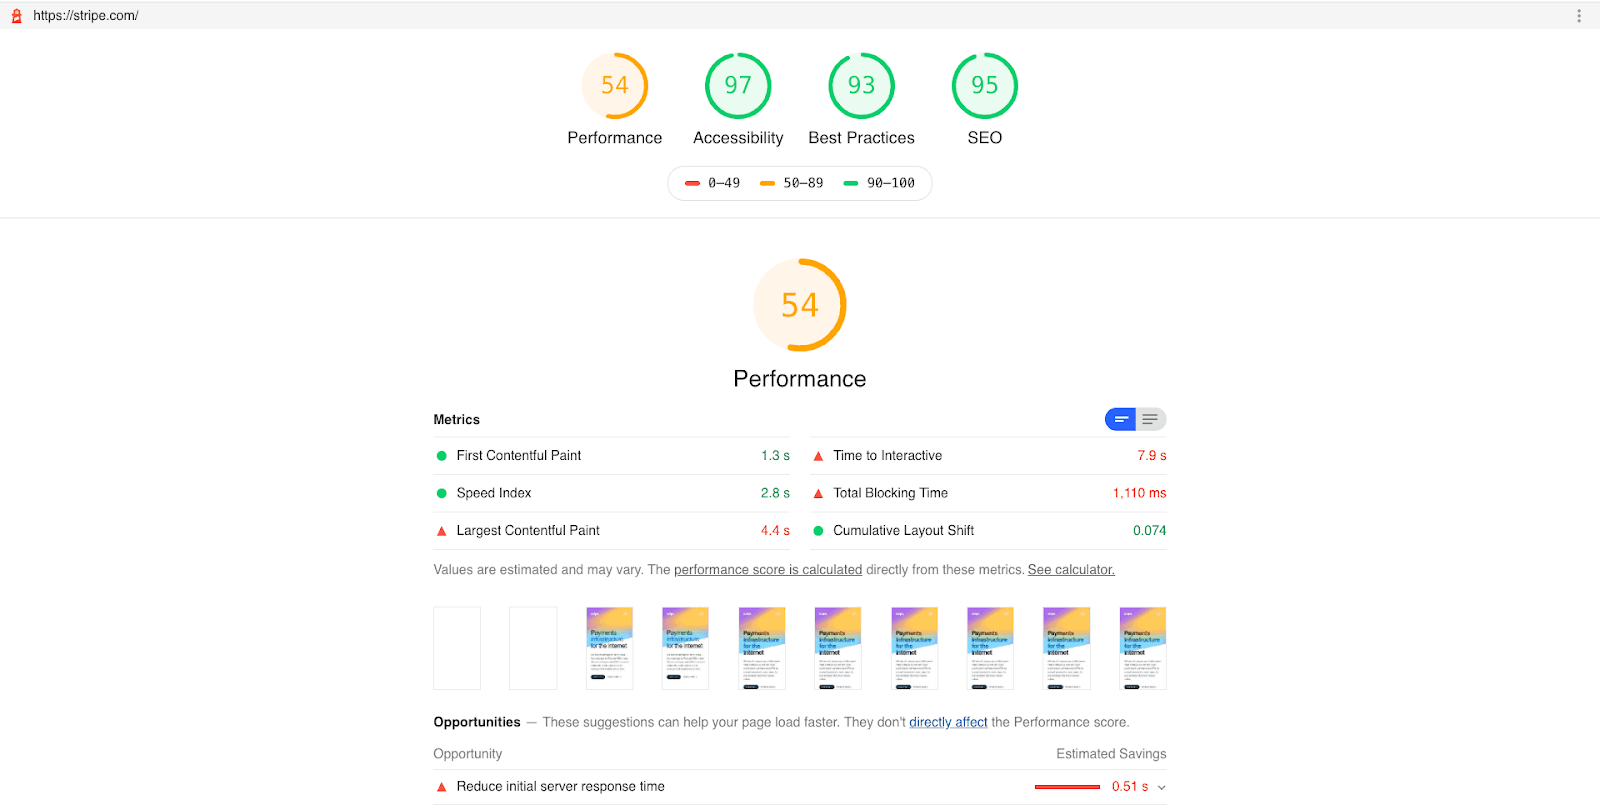
PSI can be used in one of several ways: through its web app, Chrome developer tools, browser extensions, or API. To dip a toe into the pool of PSI’s offerings, you can go to https://web.dev/measure/ and input a URL to analyze a page’s performance. The report will look something like this:
If you’re using Chrome, you can also access this from your developer tools through the Lighthouse tab or the Audits tab if you’re on an older version of Chrome.
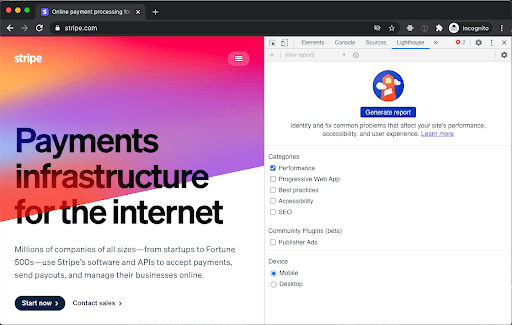
This is fairly straightforward, but one thing that I want to highlight is the “Opportunities” section for both the web app and dev tools. This lists potential improvements sorted by the highest impact. Expanding an opportunity will reveal a link to an article by Google PSI that explains the metric and how to improve it.
The last method to access Google PSI that we’ll discuss today is the Google PageSpeed Insights API. The API gets the same data as the web app and Chrome dev tools that we discussed in previous paragraphs, but it allows us to programmatically generate reports and store the metrics for analysis. Throughout the rest of the article, we’ll be integrating the API with our Rails app.
I know what you’re thinking: “Why should we spend the dev time to integrate an API when the web app and dev tools return the same information and can be used immediately?” Well, the API provides a number of benefits. We can trigger the API call through a cron job to get daily metrics to save in our database and create reports on. Alternatively, we can trigger the API on deploy and incorporate this into our CI/CD workflow. Either way, using the API programmatically allows us to monitor the performance of our application and notice errant behavior immediately.
How to Implement Google PageSpeed Insights API
In this example, we’ll be making daily calls to Google PSI and saving it to our database for reporting.
We will break this down into five steps:
- Create a PageSpeed Insight model
- (Optional) Get a Google PageSpeed Insight API key
- Create a Rails class that will act as our PSI client
- Create a rake task that will call our PSI client
- Implement the cron job to gather PSI metrics using Heroku Scheduler
First, let’s create our model via the command line:

Now, let’s get an API key from Google APIs. Depending on how you plan to use Google PSI, this step could be optional. If you’re just testing this out, an API key is not required. If you’re planning on using this in a production environment with a larger volume of usage, an API key is probably desired.
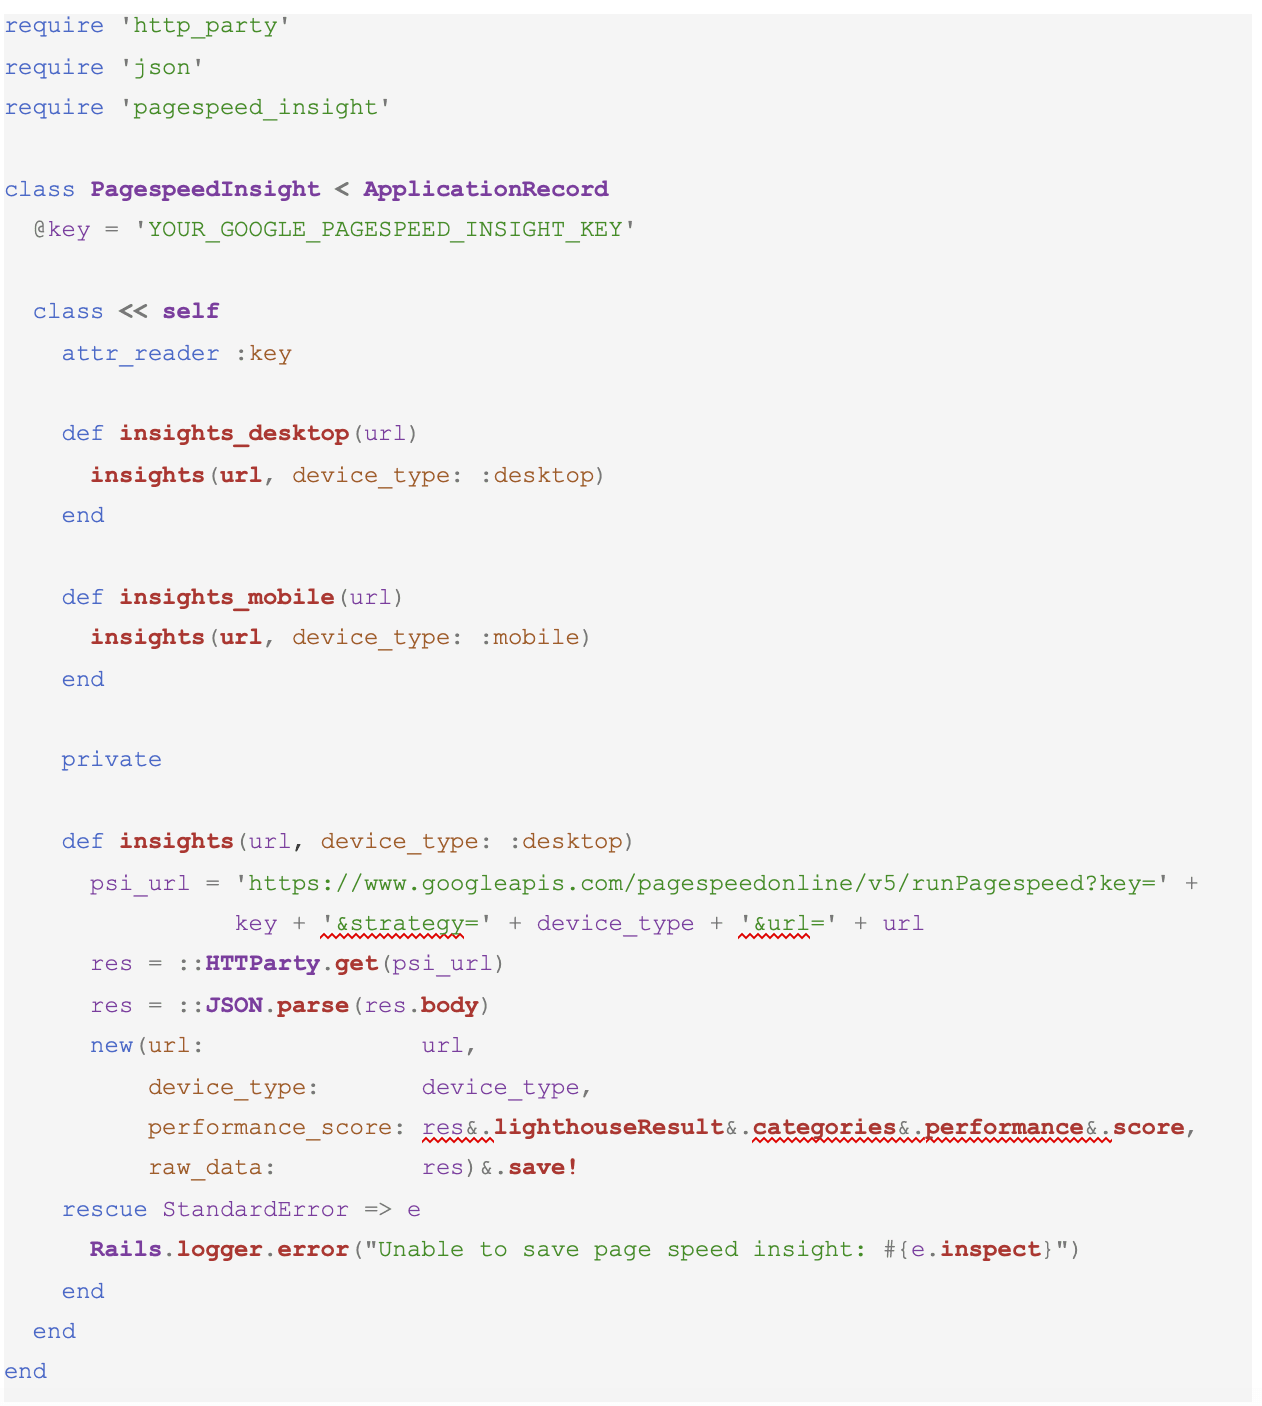
Once you have your API key, it’s time to make the API call and save the data to our newly minted model. It should look something like this:
Next, we’ll need to list out which URLs we care to test and get the jobs ready for scheduling. Let’s do this in a rake task:
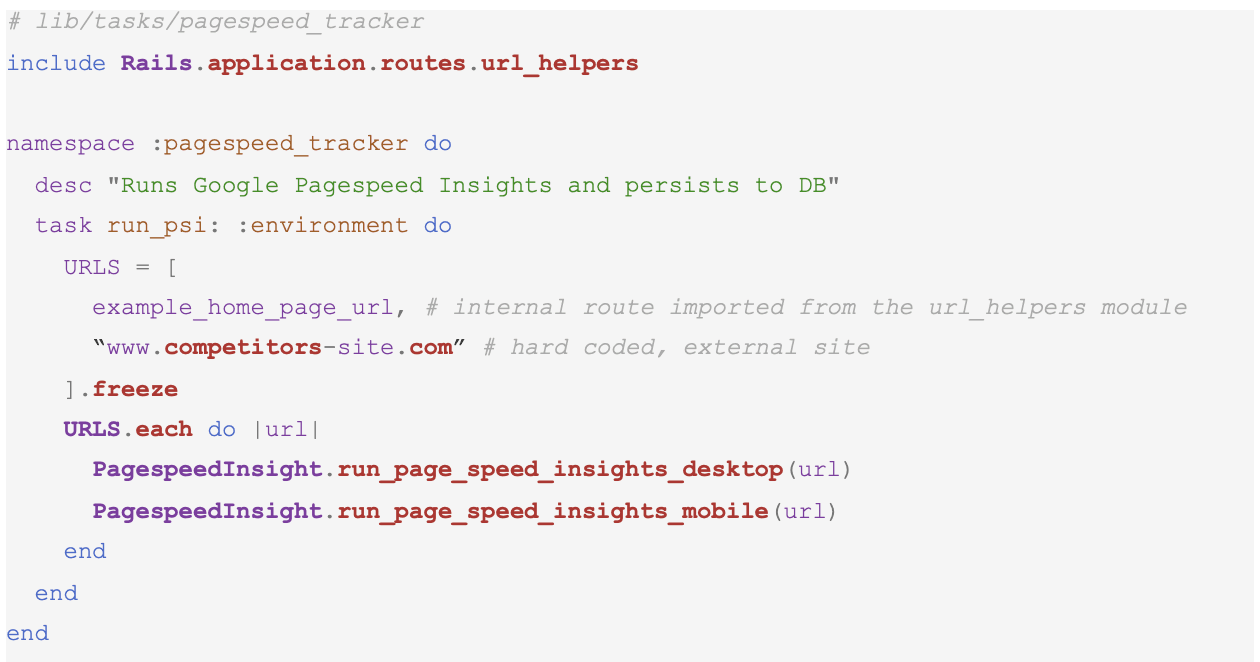
In our example, we’ll be using Heroku and the free add-on, Heroku Scheduler, to kick off this rake task daily. If you have any questions about setting up Heroku Scheduler, their documentation is fairly comprehensive.
After adding the task to Heroku Scheduler, the rake task will run daily at the specified time:
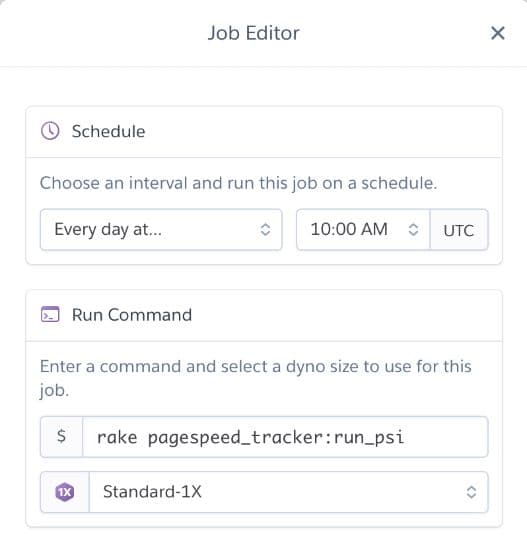
Alternatively, you can use your cron scheduler gem of choice to kick off the following rake task:

The last, and arguably most important step, is making use of the data. After the scheduled job has run, we’ll have the Google PSI data in our database, ready to be analyzed. The graph below is one example of how you can display this data. I’d recommend hooking this up to your data analytics tool of choice to keep these metrics top of mind and set up alerts if scores drop below a certain threshold.
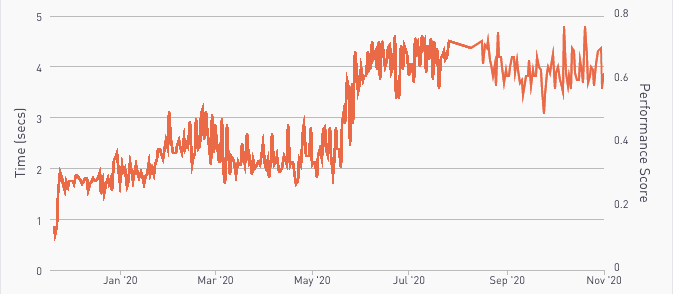
If you’re passionate about tracking and improving your site’s performance, there are companies built around application performance monitoring products. The two industry leaders, New Relic and Datadog, have free tiers with a limited number of users or trials to test out their software. Google PSI will give you the best insight into how their ranking algorithm judges your performance, but their feature list falls short of any paid service.
Wrapping It All Up
In this blog, we discussed the importance of page speed and how to use Google’s PageSpeed Insights API with your Rails app. If you’d like to learn more, please check out the links below:
- Get Started with Google PageSpeed Insights API
- Using site speed in web search ranking
- Speed is now a landing page factor for Google Search and Ads
About the Author: Taylor Wong is a growth engineer at HomeLight.